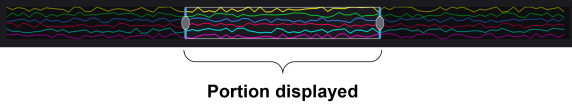
Data Preview Bar
The Data Preview Bar gives a visual indication of the portion of the trace that is currently displayed in the chart. The area within the blue vertical lines is the portion of the trace that is currently displayed.
Use Trace Display Toolbar to zoom in/out and auto scale the displayed data.
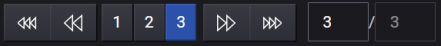
For Trace Datalogging mode in Trace Data view only, use the browse controls (<<<, <<, >>, >>>) above the chart to traverse the displayed data one window or one grid at a time. You can also click the number to display the desired portion of the trace.